

Quick guide to 7 major ranking reports
A concise overview of seven major global university rankings and their methodologies
Understanding university rankings
University rankings vary widely in scope and methodology, each shaped by distinct indicators and priorities. For institutions tracking rankings or developing a rankings strategy, understanding what each ranking measures – and how – is essential. Yet, with so many rankings available, navigating them can be challenging.
This guide offers an overview of several widely recognized university ranking systems to help you gain insight into their methodologies, data sources and contexts of use.
While rankings can highlight different university strengths, no single ranking tells the full story. Universities pursue unique missions and goals, using data in different ways to communicate their strengths to students, faculty, partners and policymakers. Rankings are just one piece of that broader narrative
Methodology and data disclaimer
Note: Methodology information and data sources are current as of November 5, 2025. However, ranking methodologies are updated periodically by their respective organizations; therefore, indicator definitions, weights or data sources may change from year to year. The overviews provided in this guide are summarized based on each ranking bodies web pages, for the most accurate and current information, readers should refer to the official methodology pages linked throughout this guide.
Rankings covered:
- Academic Ranking of World Universities (ARWU)
- CWTS Leiden Ranking (Traditional Edition)
- QS World University Rankings
- Times Higher Education World University Rankings
- U.S. News & World Report – Best Global Universities
- Times Higher Education Impact Rankings
- QS World University Rankings by Subject
Academic Ranking of World Universities (ARWU)
Ranking organization: ShanghaiRanking.
Ranking report: Academic Ranking of World Universities (ARWU).
Report focus: Global.
Purpose statement: To present the world’s top 1,000 research universities annually based on a transparent methodology and objective third-party data.
Scope: More than 2,500 universities are evaluated annually; the results for the top 1,000 are published.
Candidate universities: Universities with significant research output. Any university having Nobel Laureates, Fields Medalists, Highly Cited Researchers (HiCi) or papers indexed in Nature, Science or the Web of Science Core Collection are included in the candidate pool.
Data sources:
- Nobel Prizes (official Nobel site) and Fields Medals (International Mathematical Union) – alumni and staff counts
- Highly Cited Researchers list (HiCi) – Clarivate
- Bibliometrics: Nature and Science publications
- Bibliometrics: Web of Science-indexed publications, National or institutional data for the number of full-time equivalent (FTE) academic staff
Timing: Annually (August).


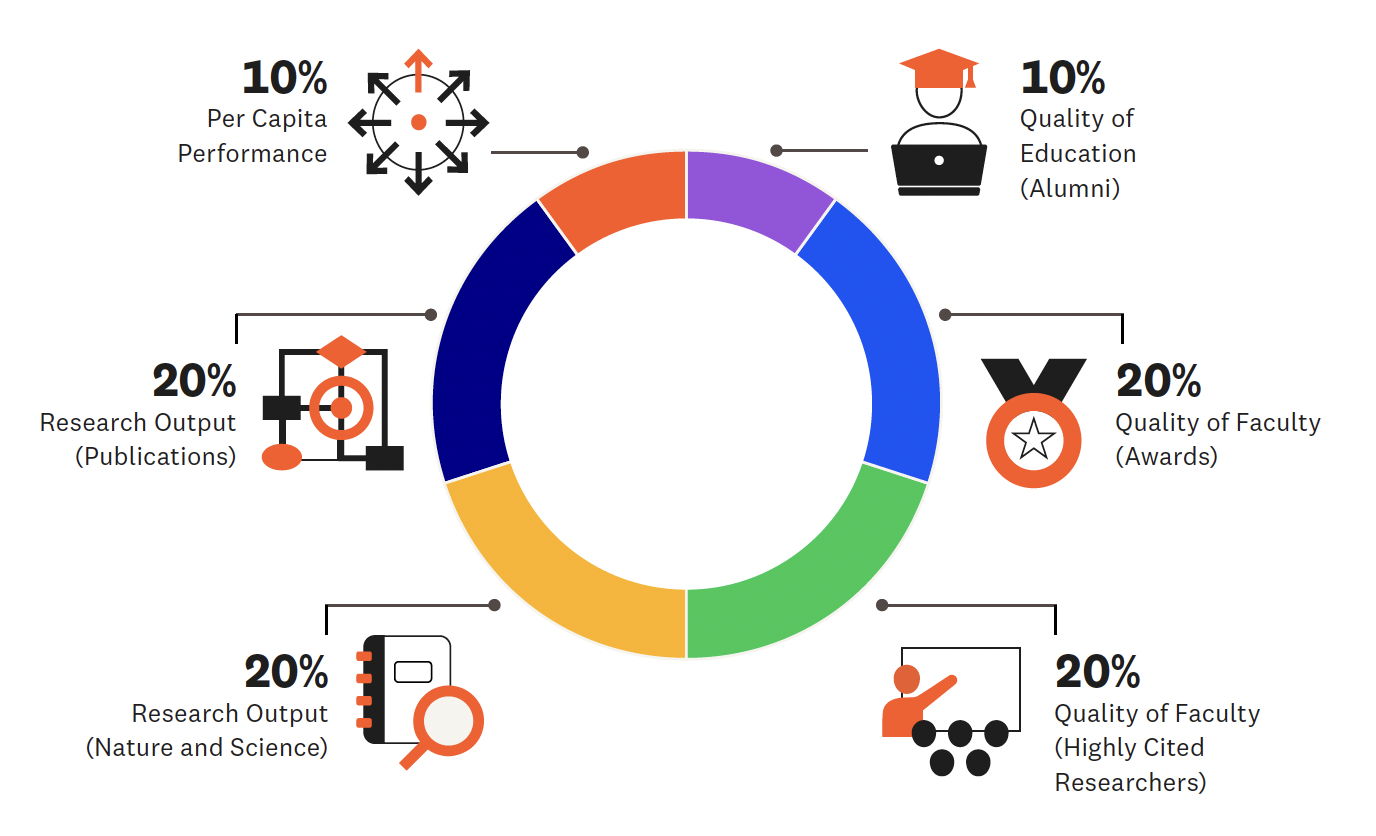
Ranking methodology
For each indicator, the highest-scoring institution is assigned a score of 100; other institutions receive a percentage score relative to the top performer.
Indicators and weights (current methodology)
|
Indicator |
Weight |
Description |
|---|---|---|
|
Quality of Education (Alumni) |
10% |
Alumni of an institution winning Nobel Prizes or Fields Medals |
|
Quality of Faculty (Awards) |
20% |
Staff of an institution winning Nobel Prizes or Fields Medals |
|
Quality of Faculty (HiCi) |
20% |
Researchers recognized as Highly Cited Researchers (HiCi) by Clarivate |
|
Research Output (Nature & Science) |
20% |
Papers published in Nature and Science |
|
Research Output (Publications) |
20% |
Papers indexed in the Web of Science Core Collection |
|
Per Capita Performance (PCP) |
10% |
Weighted sum of the five indicators divided by the number of full-time equivalent (FTE) academic staff (a formula is applied when staff data are not available) |
For institutions specialized in the humanities and social sciences, indicators related to publications in Nature and Science are not considered.

CWTS Leiden Ranking (Traditional Edition)
Ranking organization: Centre for Science and Technology Studies (CWTS), Leiden University.
Ranking report: CWTS Leiden Ranking (Traditional Edition).
Report focus: Global research-intensive universities.
Purpose statement: To serve the research community by offering high quality information on university performance.
Scope: Over 1,500 major universities worldwide.
Candidate universities: Any university meeting the publication threshold is automatically included (produced at least 800 publications indexed in the Web of Science database over the most recent five-year period).
Data sources:
- Bibliometrics: Web of Science database (Clarivate)
- CWTS in-house data and normalization procedures for field, publication year and document type
Timing: Annually (typically April or May).


Ranking methodology
The Leiden Ranking presents a variety of indicators, enabling the performance of universities to be explored from a diversity of perspectives. It is based entirely on bibliographic data on scientific publications. The ranking does not calculate a single composite score or overall rank. Instead, it presents a set of bibliometric indicators that allow users to explore performance dimensions independently.
About the data and indicators
The Leiden Ranking (Traditional Edition) considers only a subset of publications from the Science Citation Index Expanded, Social Sciences Citation Index and Arts & Humanities Citation Index. These are referred to as core publications – articles written in English, authored (not anonymous), not retracted and published in international journals that meet CWTS criteria for citation analysis. Journals must have an international scope and sufficient citation links to other core journals, which generally excludes trade journals and popular magazines.
This methodological summary is condensed; readers are encouraged to consult the CWTS Leiden Ranking site for full definitions and data coverage.
Readers can explore detailed indicator definitions and methodologies https://traditional.leidenranking.com/information/indicators
Indicator groups (current methodology)
|
Type of Indicator |
Weight |
Indicators* |
|---|---|---|
|
Scientific impact |
Measures scholarly output and citation impact relative to global averages |
P, P(top 1%, top 5%, top 10%, top 50%), PP(top 1%, top 5%, top 10%, top 50%), TCS, MCS, TNCS and MNCS |
|
Collaboration |
Captures international, national and industry co-authorship |
P, P(collab), PP(collab), P(int collab), PP (int collab), P(industry), PP(industry), P(<100 km) (<5,000km) and PP (<100 km) (<5,000km) |
|
Open access |
Reflects the share of publications available openly across different OA models |
P, P(OA), PP(OA), P(gold OA), PP(gold OA), P(hybrid OA), PP(hybrid OA), P(bronze OA), PP (bronze OA), P(greenOA), PP(greenOA), P(OA unknown) and PP (OA unknown) |
|
Gender diversity |
Provides insight into the gender distribution of authors |
A (number of authorships), A(MF), A(unknown), PA(unknown), A(M), PA(M) and PA(M | MF), A(F), PA(F), PA(F | MF) |
All indicators are based on fractional counting unless full counting is selected. Normalization accounts for field, publication year and document type.
*P = number of publications, PP = Proportion of publications, (x%) = top x %, Collab = co-authored publications with one or more organizations, int. collab = international collaboration, industry = collaborative publications with industry, OA = Open Access, A = number of authorship, M = male, F = female. For full description of each, visit CWTS Information page.
QS World University Rankings
Ranking organization: QS Quacquarelli Symonds.
Ranking report: QS World University Rankings.
Report focus: Global.
Purpose statement: To highlight leading universities worldwide based on global reputation, research performance and international engagement.
Scope: Evaluates over 5,600 universities and ranks more than 1,500 institutions.
Candidate universities: Universities offering undergraduate and postgraduate programs with measurable research output are considered for inclusion.
Data sources:
- Academic and employer reputation surveys (collected by QS)
- Bibliometrics: Scopus data and metrics extracted from SciVal (Elsevier)
- Institutional data provided directly to QS
Timing: Annually (typically June). Exact publication dates are listed on the QS Rankings Performance Calendar.


Ranking methodology
QS combines reputation-based and quantitative indicators to measure academic strength, employability, research impact and internationalization. Each institution receives a weighted score across nine indicators, with results normalized to the top-performing university in each category. The overall score determines position in the global ranking.
Indicators and weights (current methodology)
|
Indicator |
Weight |
Description |
|---|---|---|
|
Academic Reputation |
30% |
Global academic survey measuring perceptions of academic excellence |
|
Employer Reputation |
15% |
Employer survey assessing global graduate employability |
|
Faculty/Student Ratio |
10% |
Proxy for teaching capacity based on staff-to-student ratio |
|
Citations per Faculty |
20% |
Research impact measured through Scopus data and metrics extracted from SciVal |
|
International Faculty Ratio |
5% |
Proportion of faculty who are international |
|
International Student Ratio |
5% |
Proportion of international students |
|
Employment Outcomes |
5% |
Effectiveness of institutions in preparing graduates for employment |
|
International Research Network |
5% |
Breadth and strength of international research partnerships |
|
Sustainability |
5% |
Institutional performance on environmental and social impact metrics |
QS applies adapted methodologies for subject, regional and sustainability rankings. The QS World University Rankings by Subject is covered in a separate section of this guide.
Times Higher Education World University Rankings
Ranking organization: Times Higher Education (THE).
Ranking report: THE World University Rankings.
Report focus: Global.
Purpose statement: Evaluate research-intensive universities worldwide to measure their performance across all their core missions: teaching, research, knowledge transfer and international outlook.
Scope: Over 1,900 universities from 108 countries and regions.
Candidate universities: Institutions must teach undergraduates, publish at least 1,000 papers over five years and provide verified institutional data to THE.
Data sources:
- Institutional data submitted to THE (academic staff, finances, student ratios)
- Bibliometrics: Scopus data and metrics extracted from SciVal (Elsevier)
- Academic reputation survey (THE)
Timing: Annually (typically September-October).


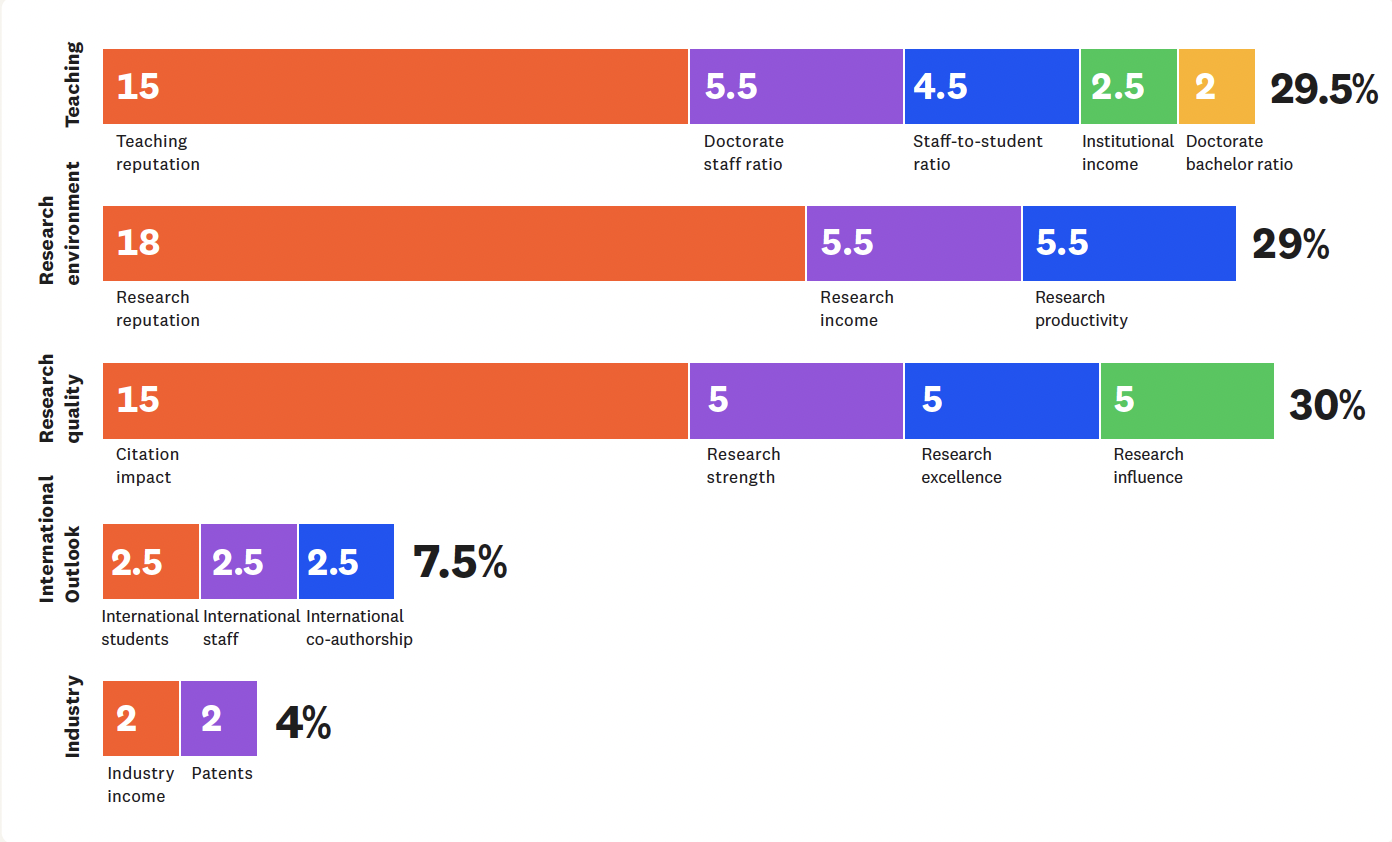
Ranking methodology
THE uses 18 calibrated performance indicators grouped into five pillars. Each pillar’s weight is based on relevance to institutional missions. Results are scaled relative to the top-scoring university in each indicator.
Indicator pillars and weights (current methodology)
|
Pillar |
Total Weight |
% Weighting per metric |
|---|---|---|
|
Teaching (Learning Environment) |
29.5% |
Teaching Reputation (15%) Student Staff Ratio (4.5%) Doctorate Bachelor Ratio (2.0%) Doctorate Staff Ratio (5.5%) Institutional Income (2.5%) |
|
Research Environment (Volume income and reputation) |
29% |
Research Reputation (18%) Research Income (5.5%) Research Productivity (5.5%) |
|
Research Quality |
30% |
Citation Impact (15%) Research Strength (5.0%) Research Excellence (5.0%) Research Influence (5.0%) |
|
International Outlook (staff, students and research) |
7.5% |
International Staff (2.50%) International Students (2.50%) International Co-authorship (2.50%) Studying Abroad* (0.0% for 2026) |
|
Industry (Income and Patents) |
4% |
Industry income (2.0%) Patents (2.0%) |
*Studying abroad is a new metric that will be added to the 2027 ranking report.

U.S. News & World Report – Best Global Universities Rankings
Ranking organization: U.S. News & World Report.
Ranking report: Best Global Universities Rankings.
Report focus: Global.
Purpose statement: Provide insight into how universities compare globally for students looking to enroll in universities outside of their home countries.
Scope: 2,250 universities across 105 countries.
Candidate universities: A pool of 2,346 is created based on two criteria: 1) universities listed in the top 205 from Clarivate’s global reputation survey, and 2) universities that have met the minimum threshold of 1,250 papers in five years, as indexed in Clarivate’s Web of Science.
Data sources:
- Bibliometrics: Web of Science and InCites (Clarivate)
- Global and regional reputation surveys conducted by Clarivate for U.S. News
- Institutional and subject-area data compiled by U.S. News & World Report Timing: Annually (typically October-November)


Ranking methodology
U.S. News calculates an overall score from 13 indicators and weights, in addition to the numerical ranks for each indicator on the schools’ profile page.
Note on related U.S. News rankings:
U.S. News & World Report also publishes several national and specialty rankings, including the Best Colleges Rankings (United States), Best Graduate Schools (United States) and Best Engineering Schools. Each of these rankings includes bibliometrics extracted by Elsevier’s SciVal (based on Scopus data).
Indicators and weights (current methodology)
|
Indicator |
Weight |
|---|---|
|
Global research reputation |
12.5% |
|
Regional research reputation |
12.5% |
|
Publications |
10% |
|
Books |
2.5% |
|
Conferences |
2.5% |
|
Total citations |
7.5% |
|
# of publications among the top 10% most cited |
12.5% |
|
Percentage of total publications among the top 10% most cited |
10% |
|
International collaboration (relative to country) |
5% |
|
International collaboration (absolute) |
5% |
|
# of highly cited papers (among the top 1% respective of their field) |
5% |
|
Percentage of total publications among the top 1% most highly cited papers |
5% |
Times Higher Education Impact Rankings
Ranking organization: Times Higher Education (THE).
Ranking report: THE Impact Rankings.
Report focus: United Nations Sustainable Development Goals (SDGs).
Purpose statement: Identify and celebrate universities that demonstrate progress towards the United Nations’ Sustainable Development Goals (SDGs) through research, stewardship, outreach and teaching.
Scope: The current edition includes over 1,700 institutions from 125 countries and regions. Universities are assessed based on their performance across selfselected SDGs and overall institutional commitment to sustainability.
Candidate universities: Any institution submitting data for at least four SDGs, including SDG 17 (Partnerships for the Goals), is eligible for inclusion in the overall ranking. Universities can also appear in individual SDG tables based on data submissions for those specific goals.
Data sources:
- Institutional submissions to THE
- Bibliometrics: Scopus data and metrics extracted from SciVal (Elsevier)
- United Nations SDG framework and indicator definitions
Timing: Annually (typically April)


Ranking methodology
THE’s ranking methodology is based on each individual SDG, meaning that every SDG has its own unique requirements. A participating university selects the SDG(s) it wishes to be assessed on and submits the relevant data and evidence.
THE combines the information a university provides with data from other sources, then evaluates how a university has performed against each SDG using metrics it has developed for that specific goal SDG.
If a university provides data on SDG 17, Partnerships for the Goals, and at least three other SDGs, it will be included in the overall ranking. Additionally, THE publishes 17 individual rankings tables, one for each SDG.
Indicators and weights (current methodology)
|
SDG category |
Weight |
Description |
|---|---|---|
|
SDG 17: Partnerships for the Goals |
22% |
Collaboration and partnership efforts that support the SDGs globally |
|
Three best-performing SDGs (combined) |
78% |
Weighted contribution from the university’s strongest three SDG areas (26% each) |
Individual SDGs
Each SDG ranking is based on bespoke indicators and metrics, relevant to the goal’s theme. There are three categories of metrics:
- Research metrics (derived from data supplied by Elsevier)
- Continuous metrics (contributions to impact that vary continually across a range)
- Provided evidence on policies and initiatives

QS World University Rankings by Subject
Ranking organization: QS Quacquarelli Symonds.
Ranking report: QS World University Rankings by Subject.
Report focus: Subject and discipline-specific global rankings (55 subjects).
Purpose statement: To highlight the world’s top universities in specific academic disciplines, helping students and institutions identify areas of global academic strength and research performance.
Scope: Over 1,500 institutions across 55 broad and narrow subject areas grouped into five overarching faculty areas: Arts and Humanities, Engineering and Technology, Life Sciences and Medicine, Natural Sciences, Social Sciences and Management.
Candidate universities: Universities are included if they have substantial publication activity and reputation survey responses within a subject area. To qualify for a ranking in a given subject, an institution must meet the minimum publication threshold and reputation response count defined by QS for that discipline.
Data sources:
- Academic and employer reputation surveys (collected by QS)
- Bibliometrics: Scopus data and metrics extracted from SciVal (Elsevier)
- Institutional data submitted directly to QS
Timing: Annually (typically March–April). See exact publication dates in the full QS rankings release calendar.


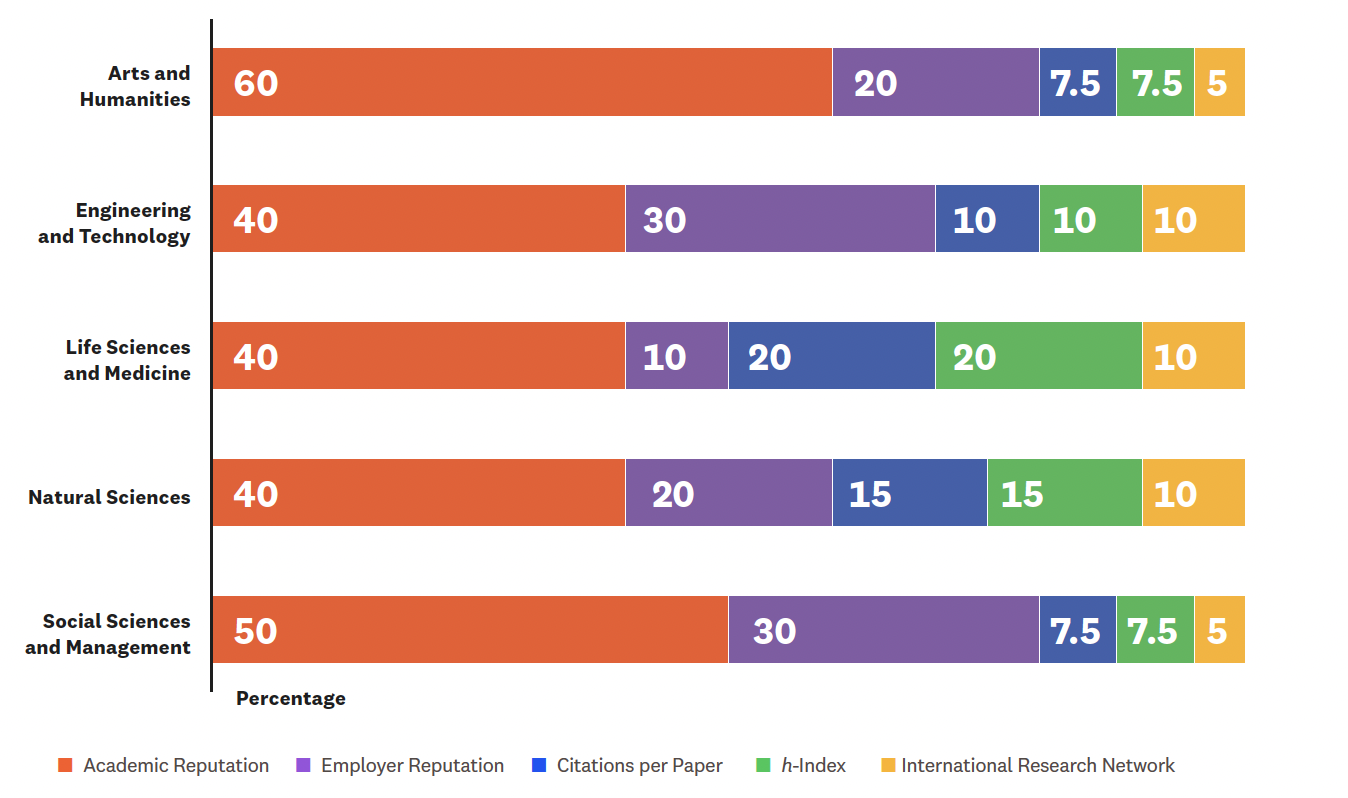
Ranking methodology
Each subject ranking is based on up to five indicators listed below. Weightings differ by discipline to better reflect research intensity, reputation and industry relevance in each field.
Indicators and weights (current methodology)
|
Indicator |
Weight Range |
Description |
|---|---|---|
|
Academic Reputation |
40-60% |
Subject-level reputation among academics worldwide based on their Academic Survey |
|
Employer Reputation |
10-30% |
Employer perception of graduates within the discipline based on their Employer Survey |
|
Citations per Paper |
5-20% |
Research impact and quality of scientific work |
|
h-index |
5-20% |
Productivity and impact of scholarly output |
|
International Research Network (where applicable) |
5% |
International collaboration patterns and sustained partnerships within the discipline |
The weighting of each indicator varies for each of the five broad subject areas and is displayed in the chart below. Each discipline also has its own weighting distribution, which you can find listed under ‘subjects and faculty areas of the QS support page here.

Closing & further resources
A broader view of universities and rankings
Rankings offer valuable insights, but they should be used thoughtfully and in context. As institutions navigate the evolving landscape of global rankings, it’s important to stay informed about methodologies and best practices. For guidance on responsible interpretation, consider exploring the IREG Observatory on Academic Ranking and Excellence page.
For deeper insights, data sources and practical tools, visit Elsevier’s University Rankings hub – a central resource for rankings guides, methodology summaries and strategic content.
University Rankings – dates to know
Tracking the release dates of key global academic rankings is easy, but keeping up with the intricate, year-round processes that produce each ranking can be challenging. To help, see our Dates-to-know chart. Categorized by ranking, it highlights important dates to assist you in planning and incorporating significant milestones into your strategy.
elsevier.shorthandstories.com/university-rankings-dates-to-know/